Rate How Student-Centered Your Learning Environment Is: Implement Practices That Are Purposeful & Valuable to Students

One test of the correctness of educational procedure is the happiness of the child.
– Maria Montessori

INTRO
This activity will assist your team in developing a shared understanding of what it means to transform the student experience (at the instructional level) that includes aligning efforts to a shared vision for readiness that supports student empowerment.
How do you create an environment where students enjoy learning because it feels purposeful and valuable to them?
OBJECTIVES
- Reflect and explore how to transform the student experience at your school.
This activity is designed for your school leaders and teachers.
Take a minute and write down some thoughts on what Transforming the Student Experience
means to you?
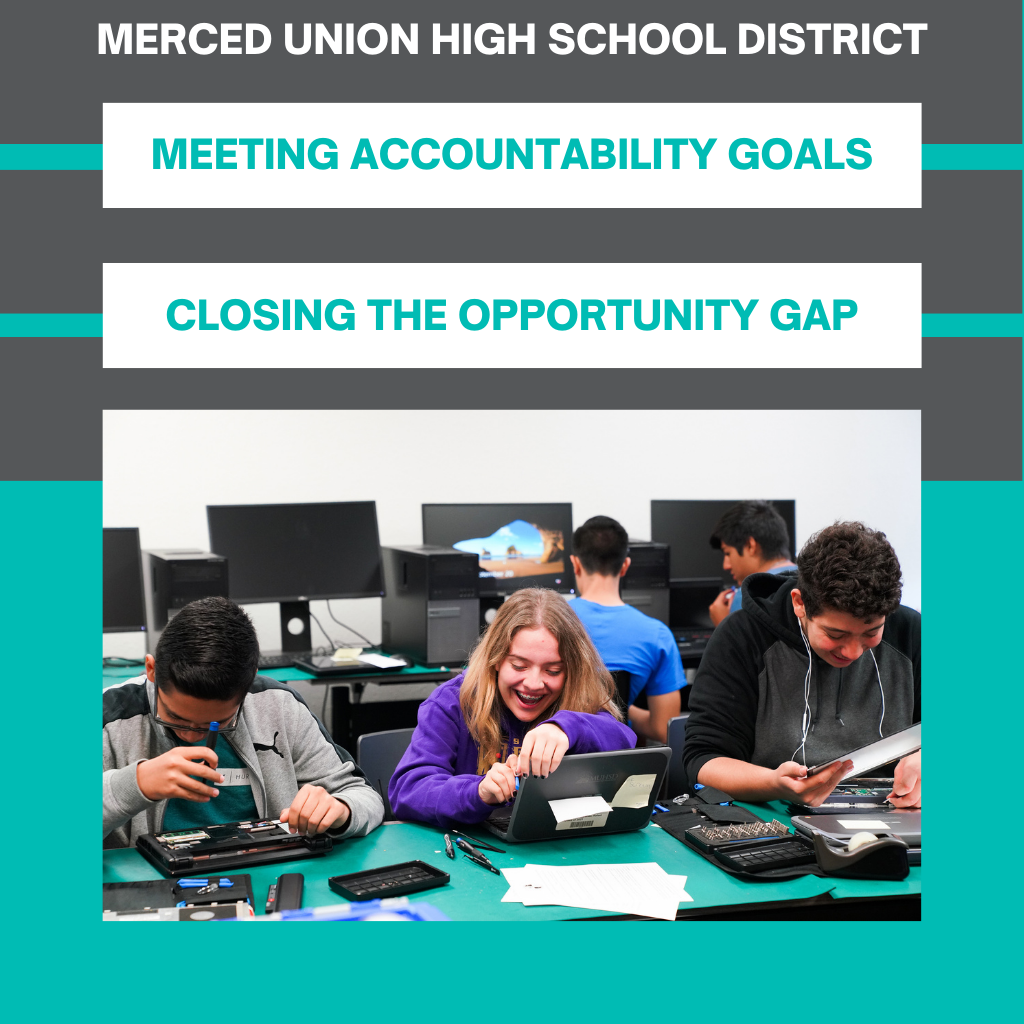
Watch the below video to see an example of what a student-centered experience looks like.
Rate and provide evidence as to whether your school is providing a student-centered
experience schoolwide using the following definition and scale:
A student-centered experience is driven by student voice; prioritizes the development of
self-knowledge and student agency; and ensures all students experience an engaging,
empowering, and inclusive learning environment.
SCALE
- Not at all
- Somewhat
- For the most part
- Totally
A score of one reflects that there is little being done intentionally schoolwide. A four would suggest that you have explicit structures and practices schoolwide to support this.
Discuss and work together to agree on a rating as a team and provide evidence.
TIPS
- Have your team show their ratings all at once using their fingers (we use the game RO SHAM BO when we work with teams).
- Then have the team members with the highest and lowest ratings share their thoughts first to get the perspectives that are most different.
- This discussion should lead to a consensus group rating.


Responses